Data analysis

The InfoCamere Dashboard

Starting from the data in the Chambers of Commerce Business Register, occasionally integrated with additional public statistics, InfoCamere has created a series of interactive Dashboards to encourage a better understanding of phenomena relating to business dynamics.

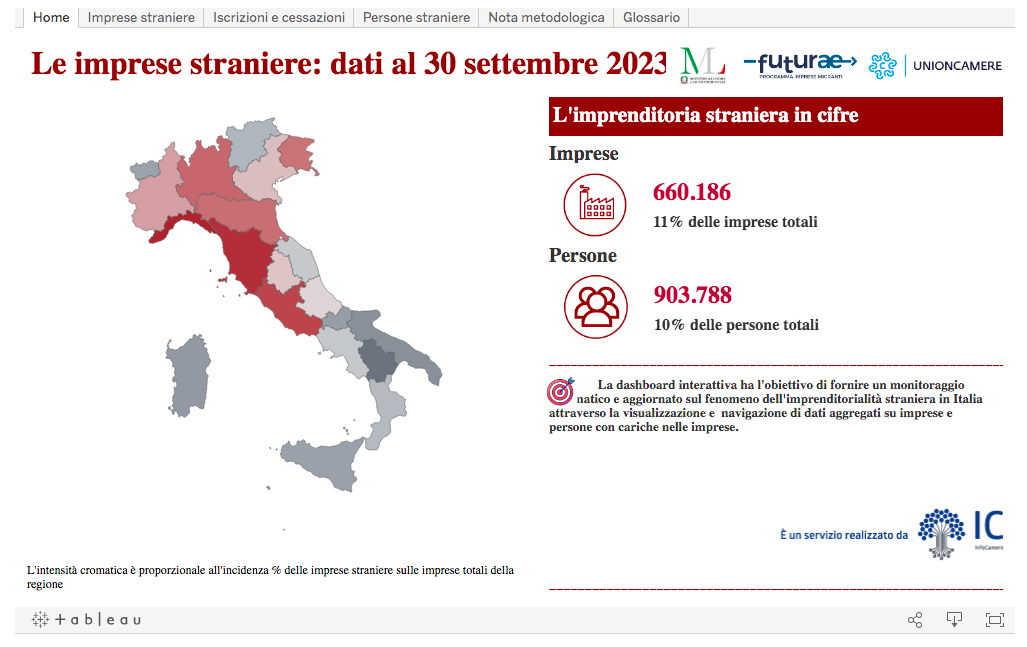
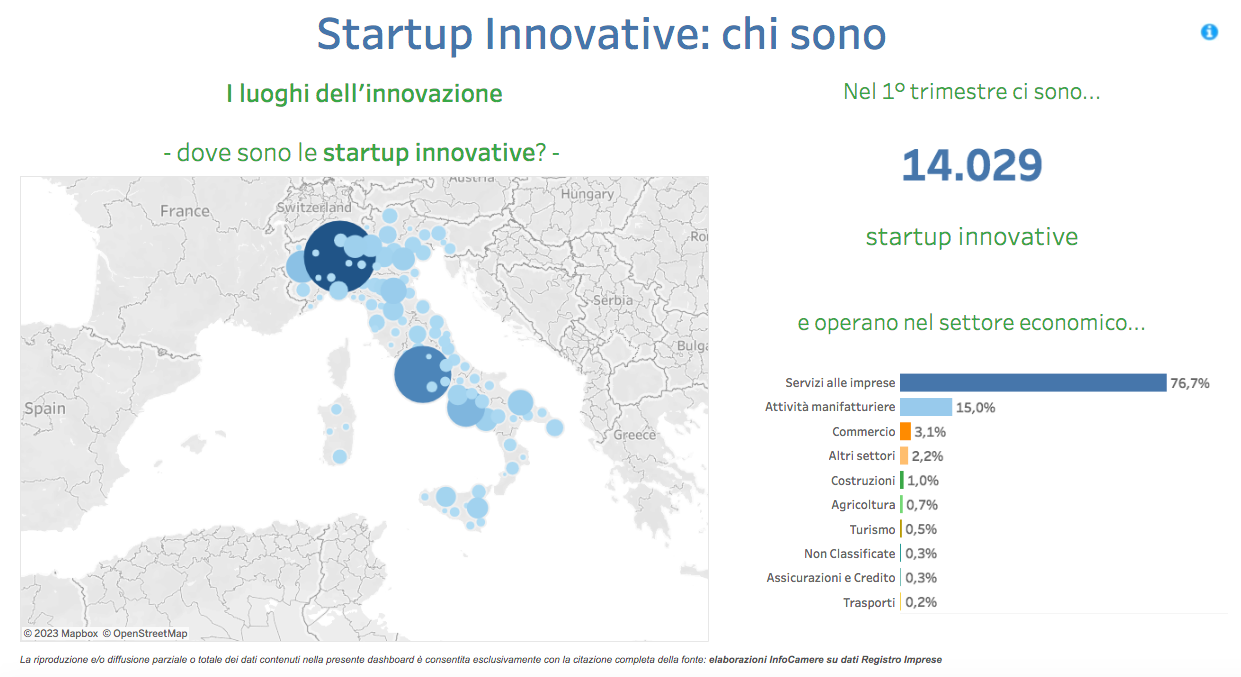
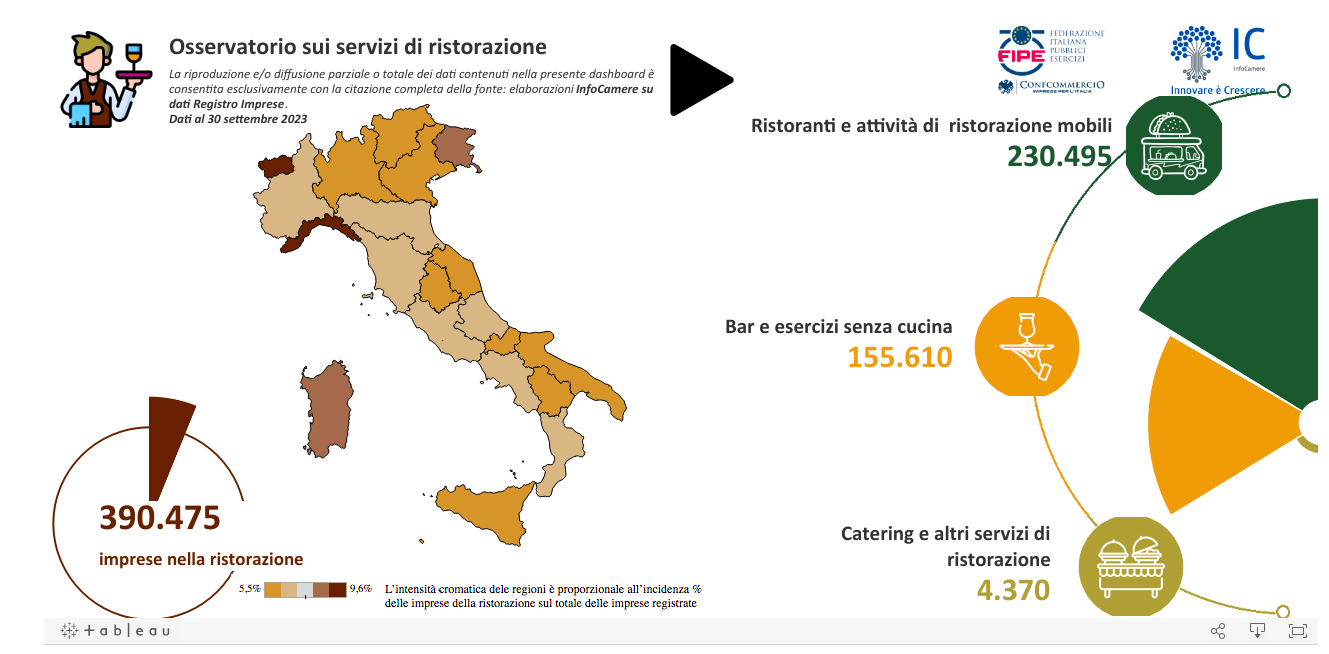
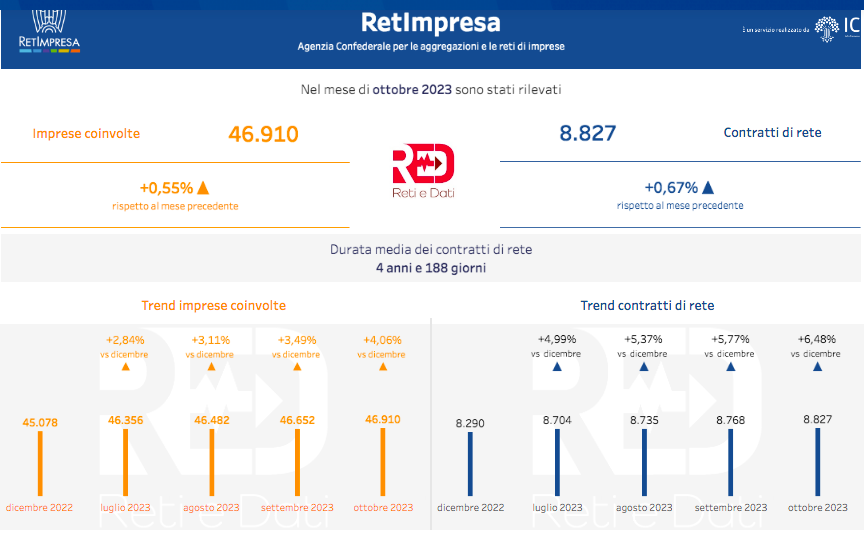
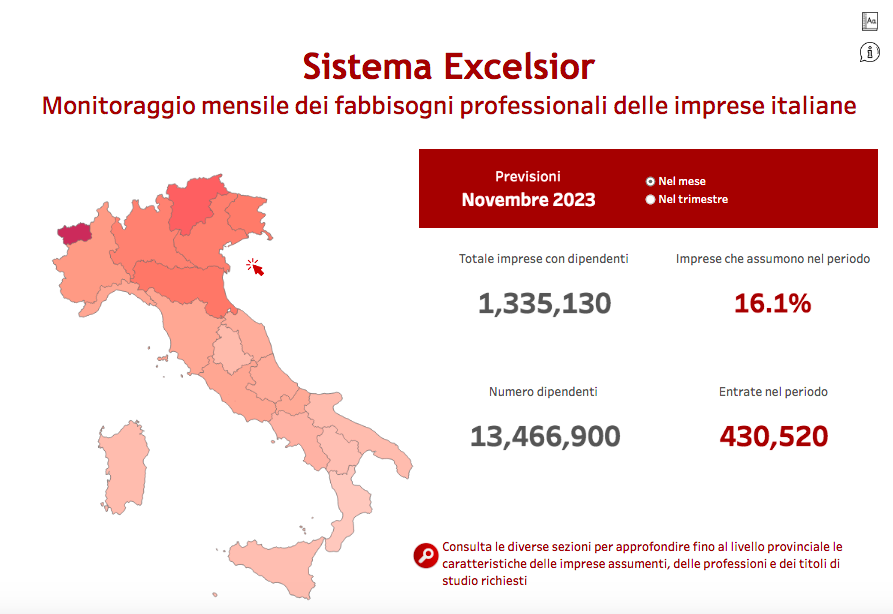
The following are some of the main Dashboards created by InfoCamere at national level

Migrant Businesses Observatory

This dashboard is used to monitor the phenomenon of businesses operated by legal immigrants in the Country and to view summary information on the dynamics of the manufacturing and business system under foreign management. . Visit the web site

dashboard_thumb_1

Start-up Observatory

This dashboard provides up-to-date information on the innovative start-ups registered in the special section of the Business Register, allowing the most innovative business segment in the Country to be read by geographical area, sector and size. Visit the web site

dashboard_thumb_2

Hospitality services Observatory

This dashboard provides a map of hospitality services in Italy, using maps and dynamic graphs to allow analysis of business structure and the economic and financial performance of companies that have filed a financial statement. Visit the web site

dashboard_thumb_3

Business networks

This dashboard, which is divided into various sections and is updated periodically using the data on network contracts and network businesses, can be used to look in depth at trends and characteristics of the phenomenon at local, economic and size level, using summaries, graphs and statistical indicators. Visit the web site

dashboard_thumb_4

Excelsior system

This dashboard is an on-line information tool for monthly/quarterly monitoring of the professional needs of Italian businesses, showing on maps, graphs and tables the aggregate data for businesses looking to hire staff, along with the professions and educational qualifications most frequently requested by businesses. Visit the web site

dashboard_thumb_5